Question 10
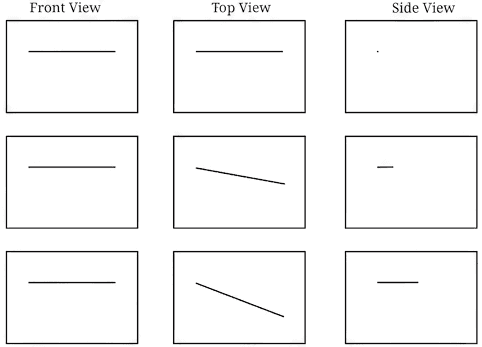
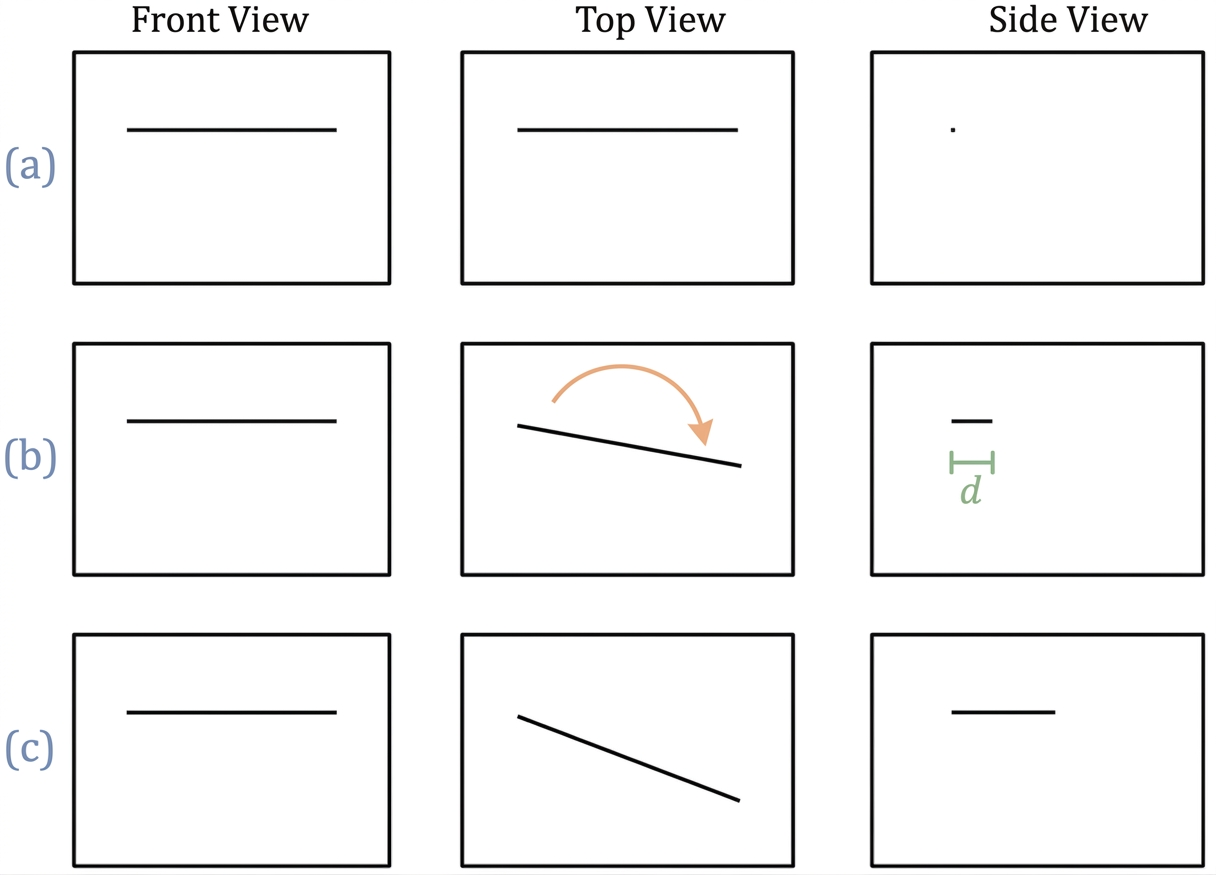
Observe the front view, top view and side view of the different lines in Fig. 4.6. Is there any relation between their lengths?
Orthographic views (front, top, side) help us understand the true shape and size of objects in three dimensions.
Step 1 — Analyze the views of each line
Let us consider the three lines, (a), (b), and (c), from top to bottom in the diagram. The Front View shows how much a line extends from left to right, and how much it extends up and down. The Top View shows how much a line extends from left to right, and how much it extends from front to back (its depth). The Side View shows how much a line extends up and down, and how much it extends from front to back.
Let's look at line (a): Its Front View is a horizontal line. This means it has no change in its up-and-down position. Its Top View is also a horizontal line. This means it has no change in its front-to-back depth. Its Side View is a single dot. This confirms it has no change in its up-and-down position and no change in its front-to-back depth. So, line (a) is a straight line that only extends from left to right. Its actual length is just its left-to-right component.
Let's look at line (b): Its Front View is a horizontal line, just like line (a). This means it also has no change in its up-and-down position. Its Top View is a diagonal line. This means it extends both from left to right and from front to back. Its Side View is a short horizontal line. Since we know it has no change in its up-and-down position (from the front view), this short horizontal line must represent how much it extends from front to back. So, line (b) extends from left to right and from front to back, but stays at the same height.
Let's look at line (c): Its Front View is a horizontal line, just like (a) and (b). This means it also has no change in its up-and-down position. Its Top View is a diagonal line, similar to (b) but appears longer. This means it extends both from left to right and from front to back. Its Side View is a longer horizontal line than for (b). Since it has no change in its up-and-down position, this longer horizontal line must represent how much it extends from front to back. So, line (c) also extends from left to right and from front to back, but stays at the same height.
Step 2 — Compare the components of length
From the Front Views, we observe that all three lines (a), (b), and (c) have the same length when viewed from the front. This means their "left-to-right" component is the same for all. Let us call this common length .
Now, let's compare their "front-to-back" components using the Side Views: For line (a), the Side View is a dot. This means its "front-to-back" component is zero. For line (b), the Side View is a short horizontal line. Let its "front-to-back" component be L_{\text{depth_b}}. For line (c), the Side View is a longer horizontal line. Let its "front-to-back" component be L_{\text{depth_c}}.
By looking at the diagram, we can clearly see that the side view of (c) is longer than the side view of (b). So, we have the relation: L_{\text{depth_c}} > L_{\text{depth_b}} And since line (a) has no depth component: L_{\text{depth_c}} > L_{\text{depth_b}} > 0
Step 3 — Determine the relation between their actual lengths
Since none of the lines change their up-and-down position (their front views are horizontal), their actual length is found by combining their "left-to-right" component and their "front-to-back" component. This is like finding the hypotenuse of a right-angled triangle. The actual length of a line is given by .
Let's find the actual length for each line: For line (a): For line (b): \text{Actual Length (b)} = \sqrt{(L_{\text{left-right}})^2 + (L_{\text{depth_b}})^2} For line (c): \text{Actual Length (c)} = \sqrt{(L_{\text{left-right}})^2 + (L_{\text{depth_c}})^2}
Since is the same for all three lines, and we know L_{\text{depth_c}} > L_{\text{depth_b}} > 0: The actual length of line (a) is the smallest. The actual length of line (b) is greater than line (a). The actual length of line (c) is the greatest. So, line (a) is the shortest, and line (c) is the longest.
Now, let's look at the Top Views in the diagram: The Top View of line (a) is a horizontal line of length . The Top View of line (b) is a diagonal line of length \sqrt{(L_{\text{left-right}})^2 + (L_{\text{depth_b}})^2}. The Top View of line (c) is a diagonal line of length \sqrt{(L_{\text{left-right}})^2 + (L_{\text{depth_c}})^2}.
Notice that the lengths shown in the Top Views are exactly the actual lengths of the lines. By visually comparing the lengths of the lines in the Top View column of the diagram: The Top View of (a) is the shortest. The Top View of (b) is longer than (a). The Top View of (c) is longer than (b). This confirms our finding that line (a) is the shortest and line (c) is the longest.
Answer
Yes, there is a relation between their lengths. Top views show that (a) is the shortest, and (c) is the longest.
More questions in FIO
Draw the initial few steps (at least till Step 2) of the shape sequence that leads to the Sierpinski Triangle.
Find the number of holes, and the triangles that remain at each step of the shape sequence that leads to the Sierpinski Triangle.
Find the area of the region remaining at the th step in each of the shape sequences that lead to the Sierpinski fractals. Take the area of the starting square/triangle to be 1 sq. unit.
Draw the initial few steps (at least till Step 2) of the shape sequence that leads to the Koch Snowflake.
Find the number of sides in the nth step of the shape sequence that leads to the Koch Snowflake.
Find the perimeter of the shape at the nth step of the sequence. Take the starting equilateral triangle to have a sidelength of 1 unit.
Figure it Out
- Which of the following are the nets of a cube? First, try to answer by visualisation. Then, you may use cutouts and try.
A cube has 11 possible net structures in total. In this count, two nets are considered the same if one can be obtained from the other by a rotation or a flip. For example, the following nets are all considered the same —
Find all the 11 nets of a cube.
Draw a net of a cuboid having sidelengths:
(i) 5 cm, 3 cm, and 1 cm
(ii) 6 cm, 3 cm, and 2 cm
Observe the front view, top view and side view of the different lines in Fig. 4.6. Is there any relation between their lengths?
Find the front view, top view and side view of each of the following solids, fixing its orientation with respect to the vertical, horizontal and side planes: cube, cuboid, parallelepiped, cylinder, cone, prism, and pyramid. If needed, see the next problem for clues.
Match each of the following objects with its projections.
Draw the top view, front view and the side view of each of the following combinations of identical cubes.
Imagine eight identical cubes, glued together along faces to form the letter 'C'.
Which solid corresponds to the given top view, front view, and side view?
Solids to choose from:
Using identical cubes, make a solid that gives the following projections:
Find the number of cubes in this stack of identical cubes.
What are the different shapes the projection of a cube can make under different orientations?
In addition to the 5 ways shown in Fig. 4.8, are there any additional ways of gluing four cubes together along faces? Can you visualise and draw these as well?
Draw the following figures on the isometric grid.
[Hint: It may be useful to determine whether the edge to be currently drawn — say, along the height — goes from down to up or up to down. Accordingly, draw the line segment on the grid either in the direction of the height axis or opposite to it.]
Is there anything strange about the path of this ball? Recreate it on the isometric grid.
[Hint: Consider a portion of this figure that is physically realisable and identify the 3 primary directions.]
Observe this triangle.
(i) Would it be possible to build a model out of actual cubes? What are the front, top, and side profiles of this impossible triangle? (ii) Recreate this on an isometric grid. (iii) Why does the illusion work?