Question 3
- The following data gives the distribution of total monthly household expenditure of 200 families of a village. Find the modal monthly expenditure of the families. Also, find the mean monthly expenditure :
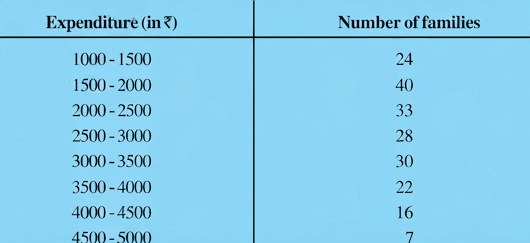
Let's find the modal and mean monthly expenditure for the families.
Step 1 — Find the Mode
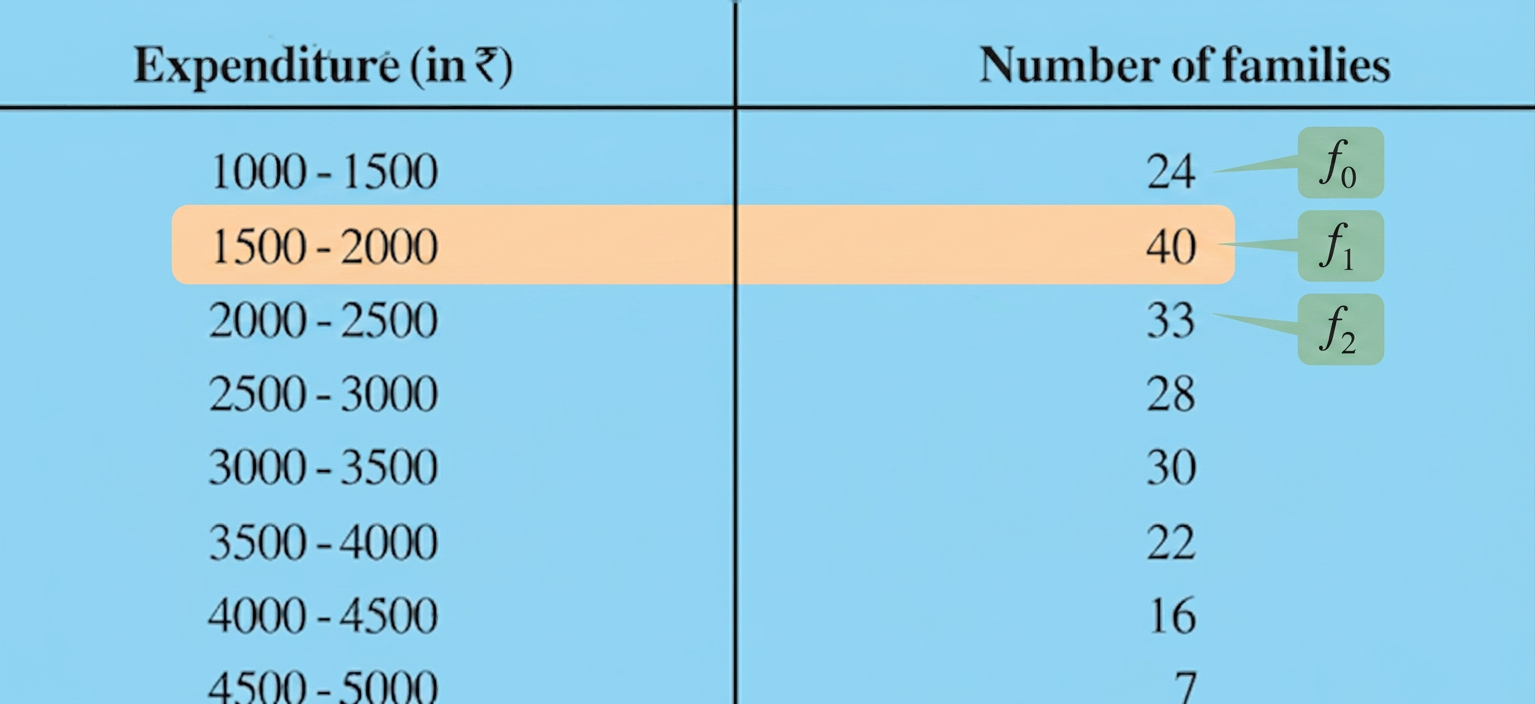
First, we find the modal class. The modal class has the highest frequency. The highest frequency is 40. This belongs to the class 1500 - 2000. So, the modal class is 1500 - 2000.
We identify the values for the mode formula. The lower limit () of the modal class is 1500. The frequency () of the modal class is 40. The frequency () of the class before the modal class is 24. The frequency () of the class after the modal class is 33. The class size () is .
We use the formula for the mode of grouped data. Mode
Step 2 — Find the Mean
Let's use the step-deviation method to find the mean. We need to calculate class marks (). We choose an assumed mean () from the class marks. Let's pick 2750. The class size () is 500.
Here is the table for calculations:
| Expenditure (in ₹) | Number of families () | Class Mark () | | | | | :----------------- | :------------------------- | :----------------- | :----------------- | :---------------- | :-------- | | 1000 - 1500 | 24 | 1250 | -1500 | -3 | -72 | | 1500 - 2000 | 40 | 1750 | -1000 | -2 | -80 | | 2000 - 2500 | 33 | 2250 | -500 | -1 | -33 | | 2500 - 3000 | 28 | 2750 | 0 | 0 | 0 | | 3000 - 3500 | 30 | 3250 | 500 | 1 | 30 | | 3500 - 4000 | 22 | 3750 | 1000 | 2 | 44 | | 4000 - 4500 | 16 | 4250 | 1500 | 3 | 48 | | 4500 - 5000 | 7 | 4750 | 2000 | 4 | 28 | | Total | | | | | |
We use the formula for the mean by step-deviation method. Mean ()
Answer
(i) The modal monthly expenditure is ₹1847.83. (ii) The mean monthly expenditure is ₹2662.50.
More questions in Exercise 13.2
- The following table shows the ages of the patients admitted in a hospital during a year:
Find the mode and the mean of the data given above. Compare and interpret the two measures of central tendency.
- The following data gives the information on the observed lifetimes (in hours) of 225 electrical components :
Determine the modal lifetimes of the components.
- The following data gives the distribution of total monthly household expenditure of 200 families of a village. Find the modal monthly expenditure of the families. Also, find the mean monthly expenditure :
The following distribution gives the state-wise teacher-student ratio in higher secondary schools of India. Find the mode and mean of this data. Interpret the two measures.
The given distribution shows the number of runs scored by some top batsmen of the world in one-day international cricket matches.
Find the mode of the data.
A student noted the number of cars passing through a spot on a road for 100 periods each of 3 minutes and summarised it in the table given below. Find the mode of the data :